In this blog posting, I show how to capture automatically an overall WLS system image, including a JFR image, after an out-of-memory (OOM) exception has occured in the JVM hosting WLS 10.3.3.
Setting up WLS Diagnostic framework
To enable event generation by WLS for JFR, the Weblogic Diagnostic Volume property has to be set to the value low, medium or high indicating the amount of recorded events. The
Diagnostic Volume can be set in the WLS Administration console -> Environment -> servers -> YourServer.
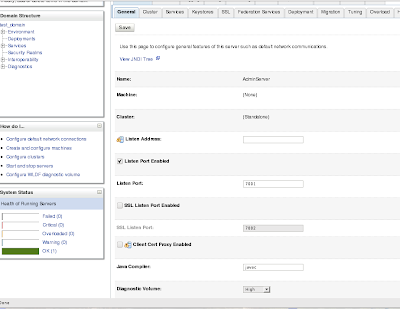
Now we have started event generation by WLS for JFR, we have to configure a WLS Diagnostic system module with a watch rule and a notification so that image capturing is triggered whenever an OOM error happens. The image capturing mechanism captures the WLS system state together with the JFR buffered event data and generates a zip file in containing the JFR file in the image folder. The image folder is specified in the WLS adminstation console -> Diagnostics -> Diagnostic images -> YourServer
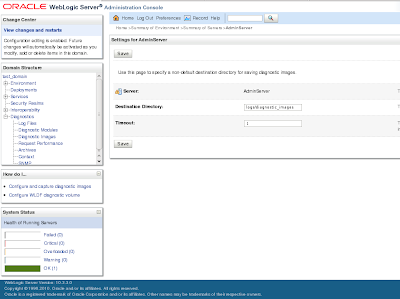
Go in the WLS Administration console to WLS adminstation console -> Diagnostics -> Diagnostic modules and create a new diagnostic module. I have called it JRFDiagnosticeModule. Click on the created diagnostic module and target it to the designated server (tab Targets). Go back to configuration tab and click on the Watches and Notifications tab to create a watch rule and a notification with following specs:
Watch rule
- Type = Server Log
- Expression = (MESSAGE LIKE '%OutOfMemoryError%')
- Use an automatic alarm so that the rule is re-enabled each time it is triggered after a defined period
Notification
- Type = Diagnostic Image
Make sure everything is enabled and the notification is associated with the watch. Leave every other setting to their defaults.
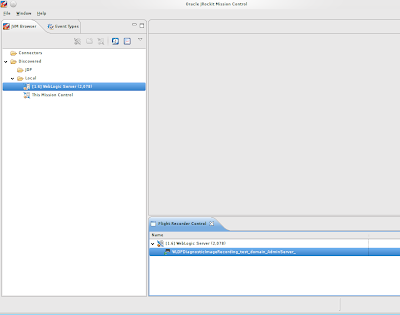
This is all we have to do in WLS 10.3.3. Before we proceed with triggering a OOM with a sample application, we first start the JRockit Mission Control (JRMC) application to verify that the JFR recording has been started. Execute the jrmc file in the folder
Generate an OOM error
To generate an OOM I've created a simple web application constisting of a simple page with a button that triggers a servlet that will execute the following code-snippet to generate an OOM in WLS 10.3.3.
 List list = new ArrayList();

        while(true){

          list.add("test string");
Deploy the web application to the WLS server and trigger the OOM by pressing the button on the page. After a few seconds you'll see this in console logging:
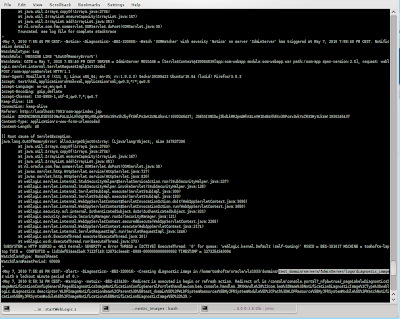
The console logging shows that the watch rule has been triggered and a image capture has been generated in the folder
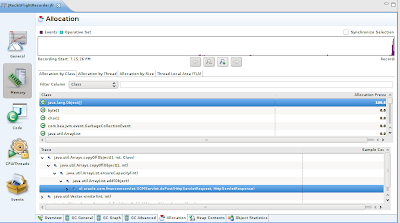
In the JRMC console you are now able to analyze the root cause of the problem. For this obvious OO example (you can also get the root cause from the console output..but the intention here is to show the capabilities of JFR in general), you can have a look at the allocation tab in the Memory panel to drill down to class that causes the String object creation (It's just an example and the JFR contains a lot more information about Threads/CPU utilization and GC executions for example):
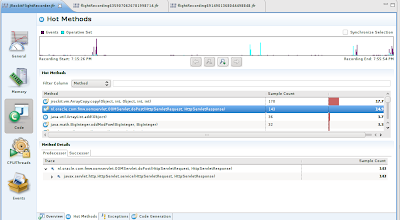
Also the Hot Method tab in the Code panel shows the servlet doPost method as a top listed hot method:
This simple and obvious example shows how easy it is to let WLS diagnostic framework continuously produce monitoring data for JFR that can be dumped to a JFR image when required, e.g. in case of OOM exception or other events. The default WLS diagnostic framework can be configured to collect a specific amount of events by using the coarse-grained Diagnostic Volume property. If you want extra events to JFR image you can start extra Recording by using the JRMC or using the command line. Also it is possible to use Java startup parameter -XX:+|-FlightRecordingDumpOnUnhandledException to trigger a JFR dump after a unhandled exception in the JVM.
Documentation:


